
Shrinidhi Rajesh
Mobile: 312-409-1712
Address: 235 W Van Buren St
Email: shrini051295@gmail.com
LinkedIn: https://www.linkedin.com/in/shrinirajesh/
I am Shrinidhi Rajesh, a dedicated Data Scientist with a Master’s in Applied Statistics and GStat accreditation. With a strong foundation in data science, machine learning, and advanced statistical methodologies, I specialize in transforming complex datasets into actionable insights that drive innovation and measurable impact.Throughout my career, I have had the privilege of working on diverse projects—ranging from predictive analytics for nonprofit organizations to optimizing enterprise compliance systems for global corporations. My expertise lies in developing robust models, designing insightful dashboards, and leveraging cutting-edge tools to solve critical business challenges.I am passionate about bridging the gap between data and decision-making by delivering data-driven solutions that empower organizations to achieve their goals efficiently and effectively. I invite you to explore my portfolio, achievements, and skillset as I continue to push the boundaries of analytics and innovation.Let’s connect to explore how we can collaborate on impactful data-driven strategies.P.S. I am currently looking for roles in the field of Data Science. I am currently in F1- OPT and would not be needing sponsorship in the near future.
Facts are stubborn, Statistics are pliable.
About
For me, data has always been more than just numbers, it is a powerful tool for change. As a Data Scientist at One Tail at a Time, I transform analytics into action, using data-driven insights to improve pet adoption rates and volunteer engagement. Every dashboard, every model, and every visualization I build contributes to a mission that truly matters: helping animals find their forever homes.My journey into data science took shape during my Master’s in Applied Statistics at DePaul University, where I graduated with distinction. Immersed in statistical methodologies and machine learning, I realized my passion wasn’t just in crunching numbers but in solving real-world problems with data.That passion led me to the Statistical Consulting Center at DePaul, where I serve as a Statistician. Here, I collaborate with researchers and professionals, applying advanced statistical techniques with Python, SAS, and R to uncover strategic insights and drive impactful decisions.Before stepping into data science, I developed my leadership and software development at IBM as a Team Lead and Data Analyst. Managing cross-functional teams and designing enterprise compliance solutions taught me the power of collaboration and innovation in tackling complex challenges.But data science is an ever-evolving field, and I thrive on continuous learning. That is why I actively pursue cutting-edge certifications, including NVIDIA Certified Associate: Generative AI & LLMs, Azure AI Fundamentals, and ASA’s Graduate Statistician (GStat) Accreditation.Now, with a diverse skill set and a relentless drive to make data meaningful, I am eager to bring my expertise to a forward-thinking team—one that values innovation, impact, and the power of data to shape a better world.
Technical Expertise
Every skill I have mastered is a purposeful investment, unraveling intricate patterns, and distilling complex data into actionable insights. My expertise is more than a toolkit; it is a commitment to transforming statistical knowledge into a driving force for impactful discoveries across diverse domains. I have learned these skills not as ends in themselves, but as the means to elevate the potential of data and contribute meaningfully to the world of statistics.
SKILLS
PROGRAMMING:
Python, SAS, R, HTML, Perl, PHP
DATABASE:
PostgreSQL, IBM DB2
SOFTWARE:
Jupyter Notebook, Power BI, Azure Machine Learning Studio, Azure AI, GitHub, Postman, Microsoft Office Suite
DATA SCIENCE LIBRARIES:
numpy, pandas, seaborn, matplotlib, scikit-learn, pyTorch, spaCy, scipy, scikit-image, statsmodels, pingouin, rjags, tidyverse, survival, RShiny, nlme, lme4, MASS, caret, forecast
CLOUD PLATFORMS:
AWS, Azure, Ansible
OTHER SKILLS
Data Preprocessing, Predictive Modeling, Time Series, Bayesian Inference, Multivariate Regression, A/B Testing, Big Data Analytics, Natural Language Processing, Deep Learning, Generative AI, Survival Analysis, Epidemiology, Clinical Research, Genomic Data Science
Work Experience
One Tail At A Time

Data Scientist
January, 2025 - Present
• Build predictive models in Python to analyze adoption patterns, identify trends, and optimize strategies to improve outcomes
• Analyze volunteer data to uncover trends, enhancing retention efforts and boosting overall volunteer engagement
• Design interactive Power BI dashboards to monitor adoption trends, volunteer activities, and resource allocation in real-time
• Communicate data-driven insights to management, facilitating strategic decision-making and improving organizational processes
Depaul University

Statistician
January, 2023 - Present
• Implemented advanced statistical methodologies to generate meaningful insights and solutions, leading to a notable 20% enhancement in project outcomes
• Spearheaded innovative analysis strategies tailored to core research questions, contributing to the evolution of robust analytical frameworks
• Provided comprehensive guidance to clients, overseeing data analysis, and facilitating actionable conclusions, streamlining workflows with a significant 15% reduction in project timelines
• Engaged in capacity-building initiatives, elevating the statistical literacy of team members for improved data-oriented analytics
Teaching Assistant
October, 2023 - November 2024
• Cultivated an engaging learning environment for undergraduate students, emphasizing practical applications of data analysis using statistical software
• Facilitated hands-on exploration to reinforce theoretical concepts within a real-world context, resulting in 5% improvement in students’ performance during each test
• Committed to enhancing student success through clear communication and engagement, fostering statistical comprehension in a data-driven context
IBM

Team Lead/ Data Analyst
February, 2018 - August, 2021
• Managed cross-functional teams and developed robust solutions to enhance compliance systems and streamlined data processes
• Developed Enterprise Compliance Management solutions for IBM systems, reducing malware risks in APAC region by 40%
• Utilized Python, Perl, and HTML to develop applications, automate scripts, and enhance system security
• Optimized MLOps workflows using Docker, enhancing malware detection precision through data preprocessing techniques
• Streamlined CI/CD data pipelines with Ansible, driving 25% efficiency improvement in data ingestion and model training
• Engineered SQL schemas, queries, and stored procedures, improving data retrieval efficiency by 23% across IBM systems.
• Led cross-functional teams in NA and Europe, driving 12% improvement in compliance metrics via targeted SME collaboration
• Orchestrated data migration to IBM Cloud, accelerating project completion by 30% via streamlined Git and Travis CI integration
• Navigated IBM-Kyndryl reorganization, maintaining 100% uptime for critical ECM frameworks and ensuring zero disruptions
EDUCATIONAL QUALIFICATION
College: DePaul University
Degree: Master Of Science
Major: Applied Statistics
Minor: Biostatistics and Data Science
GPA: 4.0
Graduation Date: November, 2024
Location: Chicago, Illinois, USA
College: SASTRA University
Degree: Bachelor of Technology
Major: Bioinformatics
Graduation Date: May, 2017
Location: Thanjavur, Tamil Nadu, India
RELAVANT COURSEWORK
Statistics
Data Science
Machine Learning
Natural Language Processing
Biostatistics
Generative AI
Large Language Models
Time Series and Forecasting
Probability theory
Survival Analysis
Epidemiology
Genetics
Data Visualization
Statistical Data Management, Bayesian Statistics
Predictive Modelling
Multivariate Statistics
Generalized Linear Regression
Simulation Techniques
Data Mining and Warehousing
Computational Biology
A/B Testing
Big Data Analytics
Clinical Research
Genomic Data Science
CERTIFICATIONS
NVIDIA Certified Associate: Generative AI and LLMs, March 2025
Graduate Statistician (GStat) Accreditation | American Statistical Association (ASA), January 2025
Azure AI Fundamentals | Microsoft, December 2024
Data Science Professional | Data Camp, August 2024
AI in Healthcare | Stanford Online, July 2024
AWS Certified Cloud Practitioner | Amazon, June 2021
Microsoft Certified Azure Fundamentals | Microsoft, February 2021
PUBLICATIONS
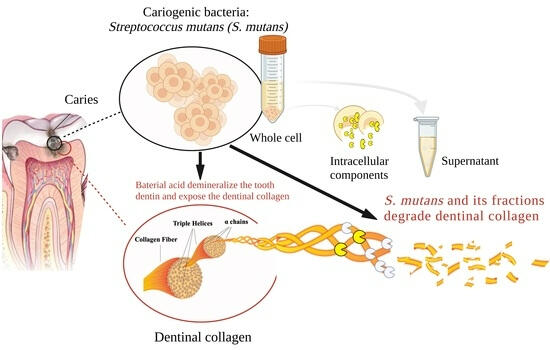
Plausible Drug Targets in The Streptococcus Mutans Quorum Sensing Pathways to Combat Dental Biofilms and Associated Risks
May, 2015
Abstract
Streptococcus mutans, a Gram positive facultative anaerobe, is one among the approximately seven hundred bacterial species to exist in human buccal cavity and cause dental caries. Quorum sensing (QS) is a cell-density dependent communication process that respond to the inter/intra-species signals and elicit responses to show behavioral changes in the bacteria to an aggressive forms. In accordance to this phenomenon, the S. mutans also harbors a Competing Stimulating Peptide (CSP)-mediated quorum sensing, ComCDE (Two-component regulatory system) to regulate several virulence-associated traits that includes the formation of the oral biofilm (dental plaque), genetic competence and acidogenicity. The QS-mediated response of S. mutans adherence on tooth surface (dental plaque) imparts antibiotic resistance to the bacterium and further progresses to lead a chronic state, known as periodontitis. In recent years, the oral streptococci, S. mutans are not only recognized for its cariogenic potential but also well known to worsen the infective endocarditis due to its inherent ability to colonize and form biofilm on heart valves. The review significantly appreciate the increasing complexity of the CSP-mediated quorum-sensing pathway with a special emphasis to identify the plausible drug targets within the system for the development of anti-quorum drugs to control biofilm formation and associated risks.
University Engagements
Ambassador for Mathematical Sciences, DePaul University
September, 2023 - June 2024
Student Panellist for International Connect Events, DePaul University
March, 2023 - June 2024
Vice Chairman, Bioinformatics Department, SASTRA University
June, 2016 - May, 2017
Head of Arts and Relationship Team, SASTRA University
June, 2016 - May, 2017
Secretary, Bioinformatics Department, SASTRA University
June, 2015 - May, 2016
Community Engagements
One Tail At A Time (OTAT)
Experienced Volunteer · Jan 2023 - Present
A dedicated volunteer at OTAT, actively taking care of animals in need and promoting adoption. With strong motives to make a positive impact and work toward their welfare.
HONORS AND AWARDS
SPARKS, IBM August, 2020
DELIVERY EXCELLENCE, IBM August, 2021
Manager’s Choice, IBM 2019, 2020, 2021
academic PROjects
An Advanced Retrieval-Augmented Generation System for Sustainable Technologies
Abstract
Yet to Fill
Summary
Yet to Fill
Survival Analysis of Canines with Cushing’s Syndrome, 2024
Abstract
Yet to Fill
Summary
Yet to Fill
A Data-Driven Population-Based Targeted Intervention for Diabetes
Abstract
Yet to Fill
Summary
Yet to Fill
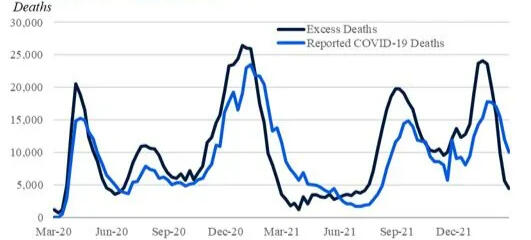
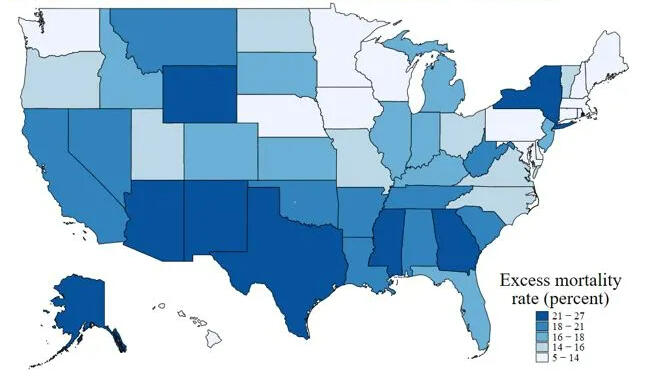
A Bayesian Analysis of Excess Deaths in the United States
November, 2023

Excess Deaths in USA
Excess Deaths in USA
Abstract
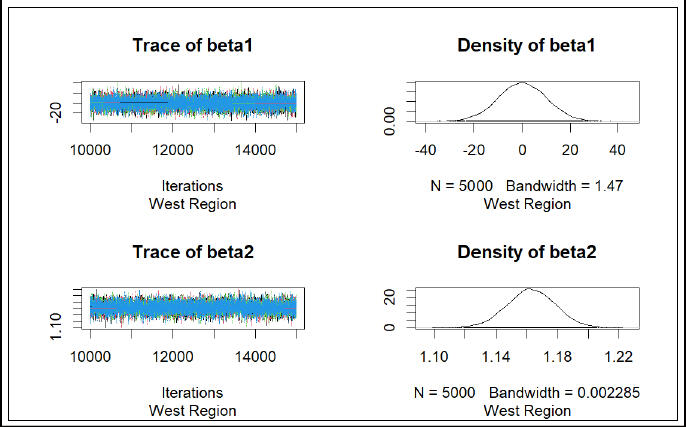
COVID-19 has had profound effects on the United States, with millions of confirmed cases and more than 1130000 deaths attributed to the virus. The examination of excess fatalities becomes a crucial tool in the never-ending quest to understand the full scope of the COVID-19 pandemic, providing a broader picture of the true magnitude of mortality. This comprehensive dataset navigates through weekly estimates of excess deaths, spanning various regions of the United States, thereby offering a wider perspective on the toll exacted by the pandemic. Beyond the confines of direct COVID-19 attributions, excess deaths are discerned as the discord between observed and expected mortality within specified temporal boundaries. The dataset not only covers deaths directly tied to COVID-19 but also sheds light on deaths from all causes, helping to uncover potential undercounting and understanding the complexities of mortality during these unprecedented times. To calculate extra deaths, the dataset uses strong Farrington surveillance algorithms, carefully considering variations in expected counts. While the estimates presented are provisional and adjusted for incomplete data, they are a valuable resource for understanding the many aspects of mortality during the ongoing pandemic. This study takes on a big task—applying Bayesian statistics to estimate all-cause excess mortality in the United States over three years. Using a multiple regression framework, we aim to unravel the factors contributing to extra deaths, with the number of deaths as the focus. Using data from 2020 to 2021, our statistical approach seeks to find patterns, relationships, and nuances that shape mortality dynamics. Recognizing the complexity of modeling each state separately, we take a practical approach by grouping states into regions. This not only makes our analysis more scalable but also captures overall trends beyond state-specific differences. After making predictions for 2022 using the trained model, we critically evaluate the results to identify regions or states that closely match actual mortality patterns. This comparison gives us insights into the effectiveness of our predictions and reveals geographical differences in extra mortality during this specific time frame. As we delve into this analysis, the study contributes not only to the growing field of Bayesian statistics but also adds valuable knowledge to understanding how mortality is changing amid the ongoing challenges of the pandemic.
Summary
• Leveraged Bayesian statistics and JAGS to estimate all-cause excess mortality in the U.S. over a 3-year pandemic period
• Applied a novel multiple regression framework to identify factors influencing extra deaths
• Provided critical insights into mortality patterns during the pandemic, offering valuable information for public health decisions and
healthcare resource allocation
Ranking of States Based on Combined Cancer Sites Prevalence Using TOPSIS Methodology
November, 2023
Abstract
This study introduces a comprehensive data preprocessing and analysis framework applied to a dataset encompassing cancer incidence and mortality rates across diverse regions in the United States. The meticulous data cleaning process involved the selection of specific cancer sites and focused on data from all 50 states, resulting in a refined dataset that includes pertinent information such as age-adjusted rates. The Technique for Order of Preference by Similarity to Ideal Solution (TOPSIS) method was employed to rank states based on multidimensional cancer age-adjusted rates. Three distinct weighing methods were applied separately for both incidence and mortality events. Sensitivity analyses were conducted on the weighing matrix, including an equal importance approach, a population proportion-based method, and a method based on weights derived from the Centers for Disease Control and Prevention (CDC) website. Notably, results indicated that CDC-based weights were the most suitable for this dataset. Within the TOPSIS analysis, the assigned ranks provide a clear picture of how each state stands in terms of the severity of both mortality and incidence rates for the specified cancers. If a state ranks highest, it's experiencing more profound challenges, whether in terms of the number of deaths or the occurrence of new cases, emphasizing the urgency for targeted public health interventions. The rankings were based on the combined age-adjusted rates for all nine cancer types, adjusted to facilitate fair comparisons between states or regions. The final TOPSIS rankings identified Washington as the state with the highest mortality rates and Wyoming with the lowest. Additionally, Alabama exhibited the highest cancer incidence rates, while Colorado had the lowest. The study concludes by using CDC-based weights for this specific dataset where the state's rank in the TOPSIS analysis serves as a comprehensive indicator of its relative standing in terms of mortality and incidence rates for the specified cancers. These findings contribute to a nuanced understanding of state-level variations in cancer incidence and mortality, underscoring the necessity for tailored approaches in public health interventions.
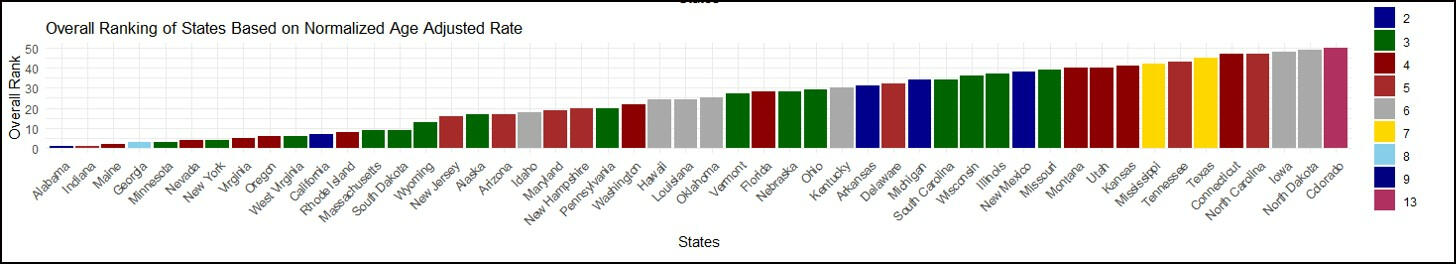
Overall Ranking For The Mortality Rate
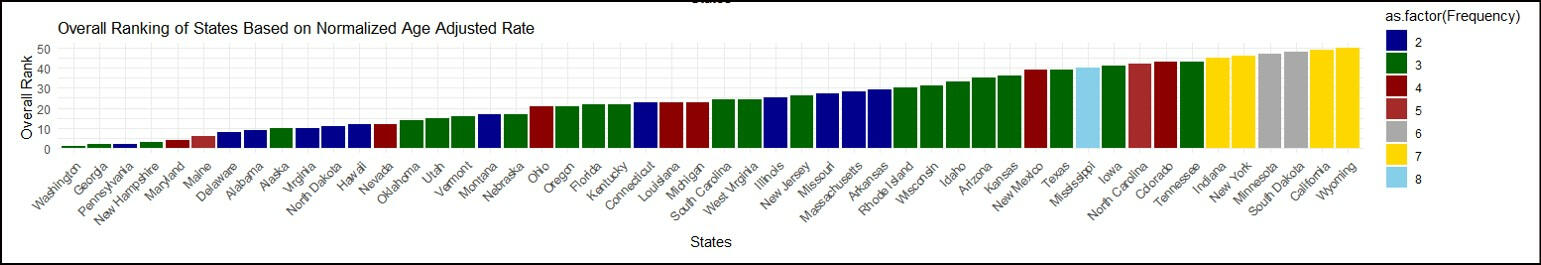
Overall Ranking For The Incidence Rate
Summary
Employed the TOPSIS methodology in R to rank states based on cancer incidence and mortality rates.
Conducted meticulous data preprocessing and utilized MICE for filling in missing data.
Exploring Kidney Disease through Computer Simulations:
Analyzing Missing Data, Associations, and Classification Techniques
June, 2023
Abstract
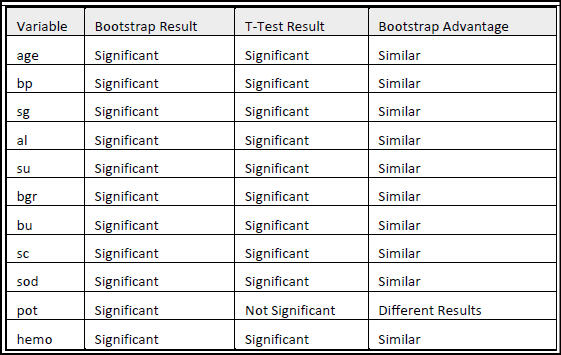
In the intricate landscape of kidney disease, this study delves deep into a comprehensive dataset, unveiling hidden characteristics, revealing intricate associations, and shedding light on effective classification, igniting the path towards enhanced diagnosis and treatment. Kidney disease is a prevalent and significant health concern, and understanding its
factors and patterns is crucial for effective diagnosis and treatment. This project aims to enhance the analysis and interpretation of a kidney disease dataset by addressing missing data, exploring associations, and improving classification techniques. Missing data pose a common challenge in healthcare research, potentially impacting patient care and research outcomes. By employing appropriate imputation techniques, the study focuses on creating a complete dataset to enhance accuracy and reliability. Additionally, bootstrap resampling techniques was used to estimate population parameters and to compare variable means between patients with and without chronic kidney disease (CKD), shedding light on key differences. The application of permutation testing provides a robust assessment of correlations, uncovering statistically
significant associations and distinguishing them from random chance. Furthermore, the study utilizes linear discriminant analysis and Monte Carlo simulations for classification purposes, evaluating the performance of a model in predicting CKD. Feature selection techniques, including permutation testing, contribute to identifying important predictors for kidney
disease classification. Finally, logistic regression models with all the attributes and the selected attributes through feature selections were compared to assess their predictive accuracy. This comprehensive analysis contributes to advancing
knowledge in the field of chronic kidney disease research and improving diagnostic and treatment strategies.
Summary
• Utilized advanced statistical techniques in R for in-depth exploration of kidney disease.
• Tackled missing data, revealed intricate associations, and optimized classification techniques.
• Enhanced understanding for improved diagnostic and treatment strategies.
Unveiling Hepatitis C: A Statistical Approach
June, 2023
Abstract
Hepatitis C is a significant global health concern, requiring accurate diagnosis and timely intervention. This report presents a comprehensive analysis of a dataset comprising 615 records, aiming to develop a robust classification model for distinguishing Hepatitis C
patients from non-infected individuals. By leveraging liver function tests and lipid measurements, the study aims to achieve accurate statistical discrimination and gain deeper insights into the interrelationships among the measured variables. This analysis aims to uncover
underlying patterns and relationships, elucidating the influential factors associated with Hepatitis C diagnosis. Additionally, the study aims to identify distinct clusters, enabling informed clinical decision-making based on prior knowledge. Overall, the results from this project contribute to the existing knowledge base, assisting healthcare professionals, researchers, and policymakers in improving patient care, enhancing diagnosis and constructing cost-effective treatment strategies for the Hepatitis C virus.
Summary
• Developed a robust classification model to distinguish Hepatitis C patients from non-infected individuals using R.
• Leveraged liver function tests and lipid measurements for accurate statistical discrimination and deeper insights into variable interrelationships.
• Contributions aid healthcare professionals, researchers, and policymakers in improving patient care, diagnosis, and cost-effective treatment strategies for Hepatitis C on a global scale.
From the Ballpark to the Hall of Fame: A Classification Analysis
May, 2023
Abstract
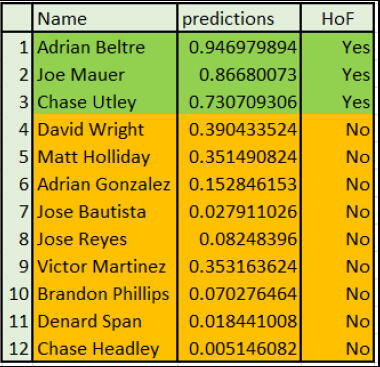
Imagine walking through the hallowed doors of the Baseball Hall of Fame, and marveling at the plaques of legendary players like Babe Ruth, Jackie Robinson, and Hank Aaron. The honor of being inducted into the Hall of Fame is the pinnacle of achievement for any baseball player, but attaining this status is no small feat. The rigorous standards for induction are
especially demanding for non-pitchers, requiring not only exceptional performance on the field but also recognition from a panel of experts. Previous research has shown that the selection process for the Baseball Hall of Fame is subjective and often influenced by personal biases and narratives. In recent years, there has been a growing interest in utilizing statistical analysis
to identify potential Hall of Fame candidates objectively. This approach has the potential to make the selection process more transparent and provide a data-driven approach to identifying deserving candidates. This study focuses on one such approach known as classification analysis by utilizing logistic regression to make predictions on whether the players will make the Hall of Fame or not. The model uses every non-pitcher who has ever received a vote for Major League Baseball's Hall of Fame with 627 players and 19 different factors associated to make the induction providing a robust foundation for analysis. This classification model is further applied to the dataset of potential candidates for the 2024 Hall of Fame, to predict who may be joining the ranks of baseball's immortals. The classification suggests that there are three players among the list of 12 potential players who have higher chances of making the Hall of Fame.
Summary
• Utilized a comprehensive approach, including logistic regression, Random Forest, and bootstrap techniques in R, to predict potential Hall of Fame candidates, focusing on non-pitcher players.
• Applied bootstrap resampling methods to assess the stability and robustness of the model predictions, which in turn contributed to a transparent selection process, enhancing the reliability of the Hall of Fame candidate predictions
• Performed in-depth analytics on player performance data, extracting key insights to inform strategic decision-making and enhance the overall understanding of player contributions within the Hall of Fame prediction framework
Exploring the Factors Influencing Breast Cancer Outcomes
March, 2023
Abstract
Breast cancer is a complex disease that presents significant challenges in understanding its progression and identifying factors that may influence outcomes. This study addresses these challenges by performing three different analysis. The main goal of this research is to perform a survival analysis on a breast cancer dataset to identify factors that influence the time until death, to investigate factors responsible for the likelihood of mortality, and to analyse the predictors that influence the increase in the number of lymph nodes The dataset comprised of 2982 primary breast cancer patients. The Cox proportional hazard model, logistic regression, and Zero Inflated Negative Binomial models were used for the respective analysis. The results showed that grade and recurrence were influencing factors for time until death, and age, grade, node, recurrence and hormonal treatment were responsible for the likelihood of mortality. The regression for count data analysis found that the Zero Inflated Negative Binomial model was the best fit for predicting the increase in the number of lymph nodes affected by tumor. Overall, this study provides valuable insights into breast cancer prognosis and identifying important predictors for better patient management.
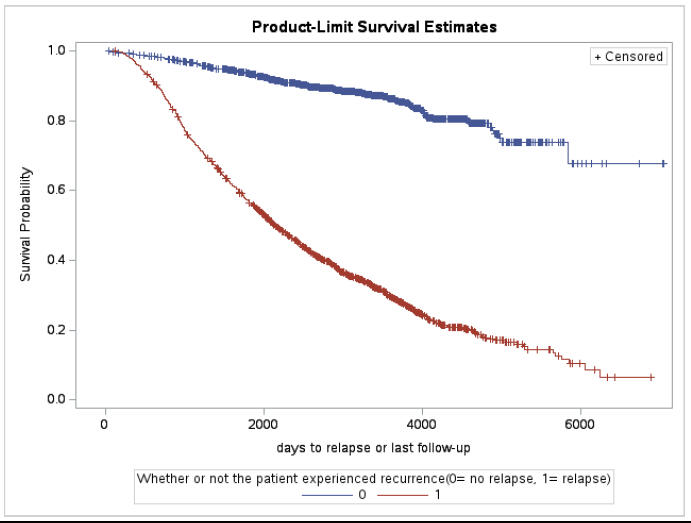
Survival Curve using Recur as strata
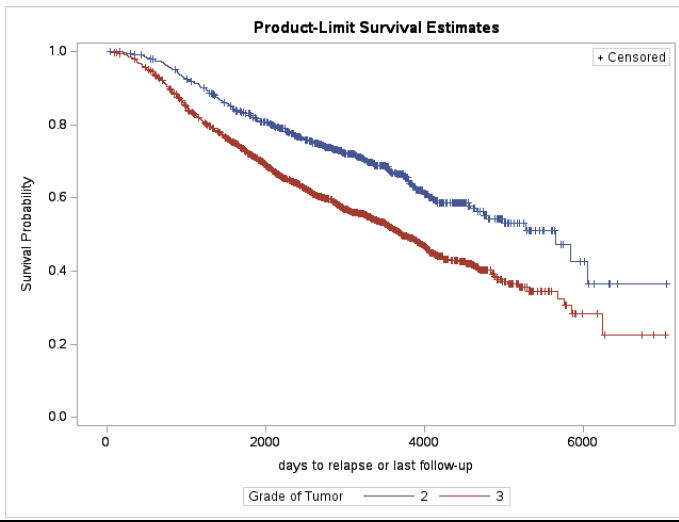
Survival Curve using Grade as strata
Summary
• Conducted Survival Analysis and utilized generalized linear models in SAS.
• Explored factors influencing time until death, likelihood of mortality, and predictors for increased lymph node count.
• Applied multivariate statistical methods for comprehensive analysis
Understanding The Factors Affecting Health Care Charges Using SAS Procedures
March, 2023
Abstract
Healthcare costs are a significant concern in the United States, with an estimated $3.8 trillion spent in 2019. To better understand the factors contributing to these costs and develop more accurate pricing models, this study investigated the relationship between age, BMI, number of children covered, smoking status, gender, region, and medical charges among health insurance beneficiaries. The main goal of the study was to determine the clinical factors that contribute to health insurance charges, to identify which factors play a role in determining these costs, and to investigate significant differences in healthcare charges across different regions, based on the number of children covered by the insurance plan and between smokers and non-smokers, different age groups, and genders. The dataset consisted of the details of 1338 insurers and seven variables. The findings indicate that age, BMI, number of children covered, smoking status, gender, and region all have a significant impact on health insurance charges. These findings can help insurance companies and healthcare providers to develop targeted interventions and strategies to manage these factors and reduce healthcare costs for patients and their clients.
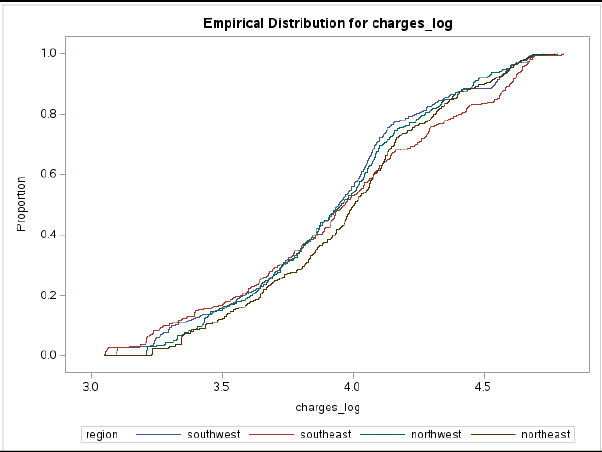
Distribution of Health Care Charges
Summary
• Identified clinical factors contributing to health insurance charges, showcasing strong analytical skills and research capabilities
• Examined the reasons behind elevated insurance charges, demonstrating a thorough understanding of the factors influencing healthcare costs
• Conducted a comprehensive analysis to identify significant differences in healthcare charges across diverse regions and assessed the impact of family size on insurance plan costs
• Investigated the correlation between charges and demographics, demonstrating a nuanced understanding of how lifestyle and demographics affect healthcare costs
Pathway-based Phylogenetic Analysis of Flavobacteria
Jan, 2017 - May, 2017
Abstract
This study presents a comprehensive analysis of the evolutionary patterns within the Flavobacterium genus genome through a pathway-based approach. The phylogenetic tree of Flavobacterium genes was reconstructed to elucidate the evolutionary relationships and divergence. Using Python, gene sequences were retrieved and codon frequencies were calculated to understand the genetic composition. Codon frequencies of individual genes were normalized based on percentage and merged with the whole genome data. Distribution analysis for individual genes was conducted using bootstrap techniques, accompanied by p-value calculations, histograms, and quantile-quantile plots generated using R. Codon volatility was assessed by comparing the codon distribution in individual genes to the overall genome distribution in V. Cholerae, yielding significant insights into genetic variability. Notably, seven genes and four proteins were identified as positively selected, highlighting their potential role in evolutionary adaptation and genomic diversity within the Flavobacterium genus. This study contributes to our understanding of evolutionary processes and genetic dynamics, with implications for microbial ecology and evolutionary biology research.
Summary
• Employed a pathway-based approach to reconstruct the phylogenetic tree of Flavobacterium genes.
• Utilized Python for data retrieval, sequence analysis, and codon frequency calculation.
• Analyzed the evolutionary patterns of the genus tree using bootstraps, random forest techniques, shedding light on genome evolution dynamics within the Flavobacterium genus.
Genome Wide Analysis of Codon Bias in Vibrio Cholerae
June, 2016 - December, 2016
Abstract
This study aims to identify genes responsible for selective pressure based on codon volatility in the Vibrio Cholerae genome strain N16961. Initially, the genome was extracted into 2534 genes using Python. These genes were then categorized based on codon bias, and bootstrapping was performed using t-statistics. The t-statistics test yielded estimated p-values, indicating the significance of codon bias within the genes. The genes with p-values less than 0.05 were considered normally distributed and were integrated to form the genome. The analysis results were visualized using histograms and quantile-quantile plots. The findings reveal that genes with p-values below 0.05 exhibit codon bias, indicating their role in the selective pressure of the genome. This study provides valuable insights into the genomic mechanisms underlying selective pressures in Vibrio Cholerae, offering potential avenues for further research and therapeutic interventions.
Summary
• Utilized Python for codon-based analysis to detect genes under selective pressure.
• Investigated the genome of Vibrio Cholerae strain N16961 comprehensively.
• Identified genes exhibiting significant codon bias, indicative of selective pressure within the genome.